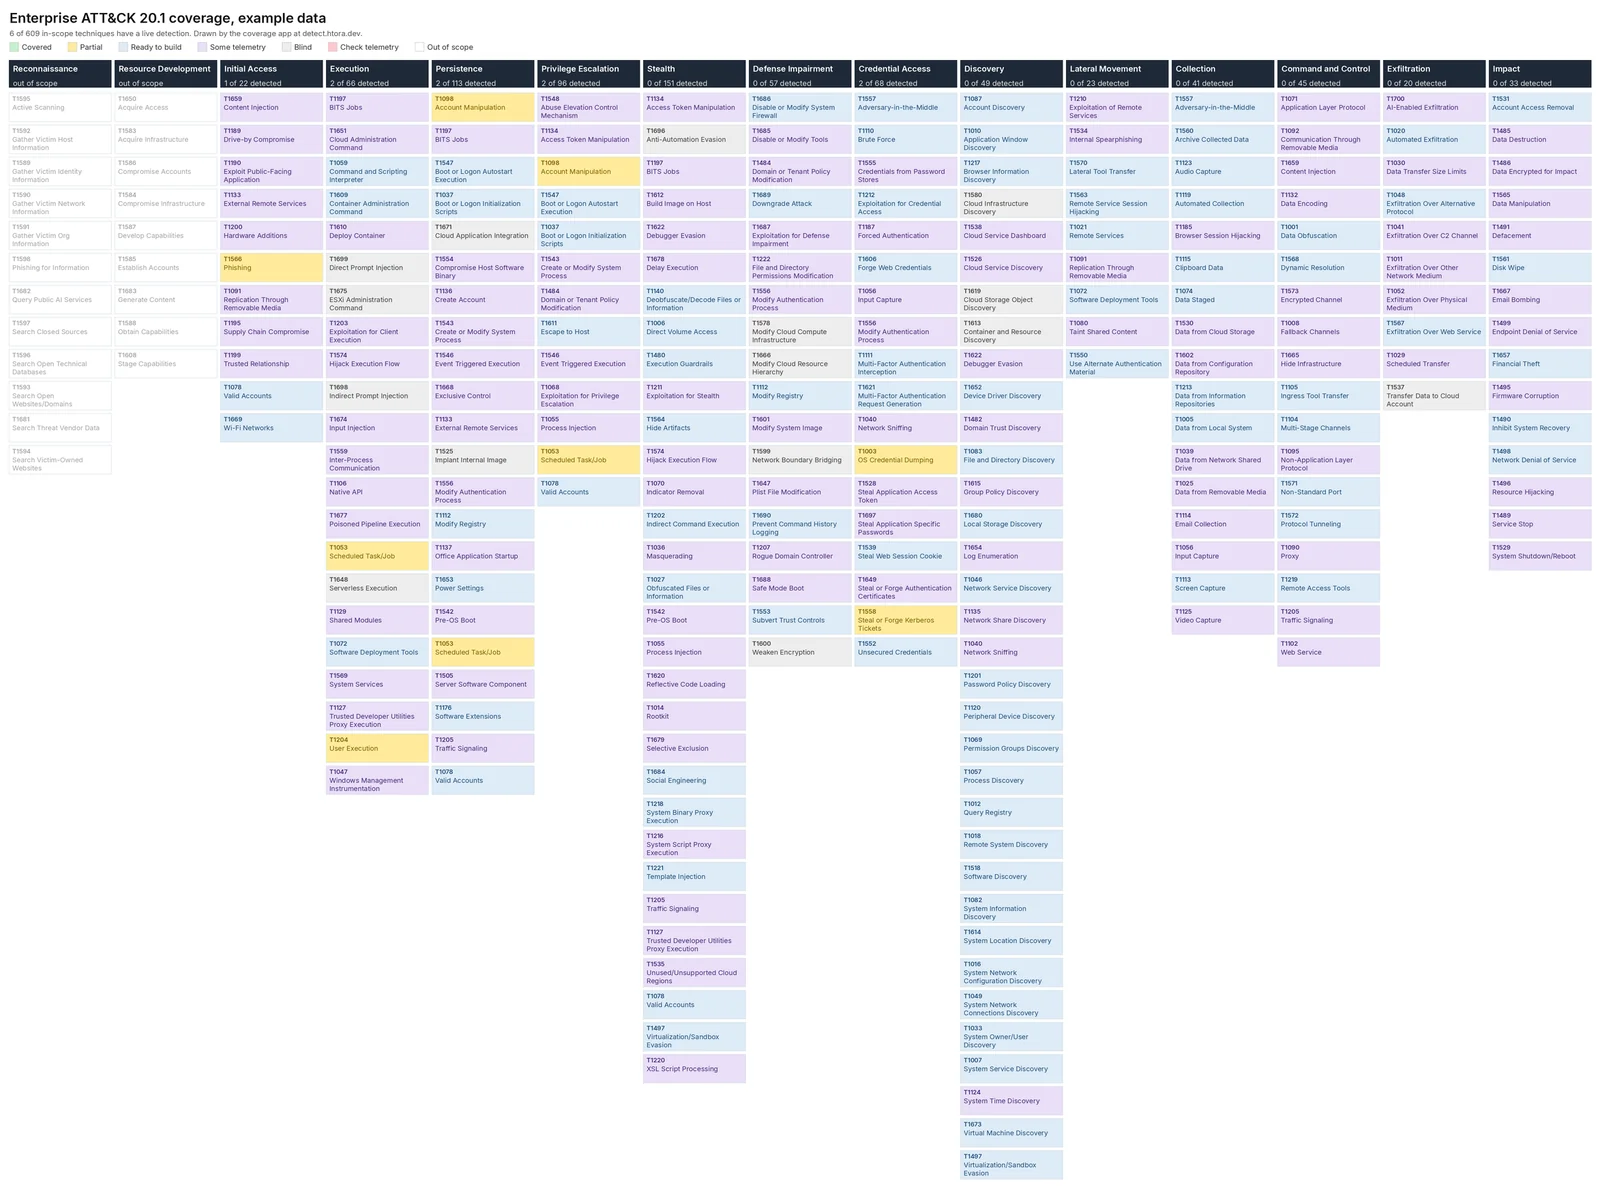
Reading about a scoring model is fine, but at some point you want to type your own numbers in. These pages do the framework's work in your browser: the ATT&CK coverage map, the query translators, and the calculators. Nothing you enter leaves the page, so there's no account to make and nobody to send your backlog to. Each tool keeps its settings in the address, so you can share a link.
The coverage app does this in your browser, and the ATT&CK coverage workbook does it in Excel. Both cover every Enterprise ATT&CK technique and sub-technique. List your detections with a robustness score and mark the data components you collect. The workbook then colors the matrix, flags detections that claim uncollected telemetry, and ranks the log sources that would complete the most of ATT&CK's analytics.
The matrix with the example data, as the coverage app draws it. Green is covered, amber is partial, blue is ready to build, purple has some of the telemetry an analytic needs, and gray is blind.